
Increased
education score
Improved
health confidence score
Nurse to Patient
Ratio Increase
Reduced
blood sugar
Reduction in
Emergency Visits
Improved
medication adherence
Education Score
Using Rita we were able to share a survey to our patients regarding the knowledge they have about diabetes. This survey measures their level of education about Diabetes before they were a part of Rita conversations and after they were educated by Rita.
80 patients were part of the survey, resulting in 91 records. 10 of the patients submitted the survey more than once with a total of 21 records whereas 70 patients submitted the survey once resulting in 70 records.Time range of the submitted survey is between December, 2019 and January, 2021. There were no submissions from June, 2020 to November 2020.
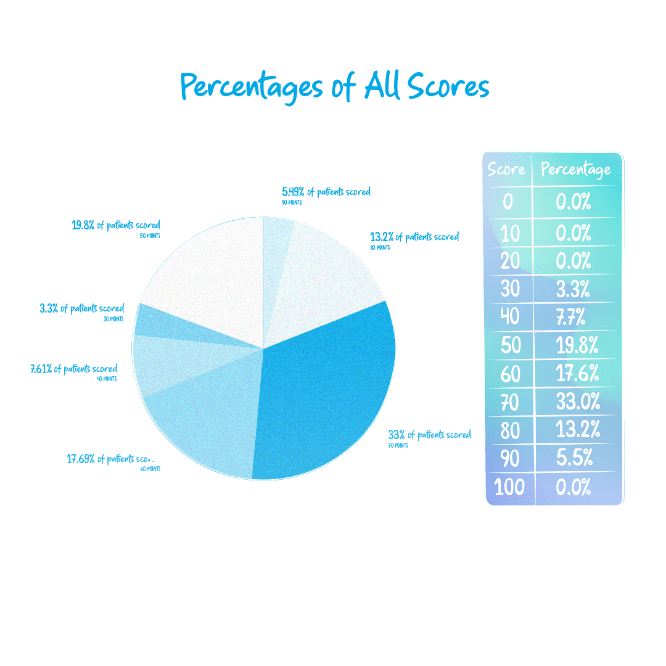
Diabetes survey consists of 10 questions with predefined answers where only one of them is correct. Each question has 10 points. 89.1% of patients have scored more than 50 points whereas 10.9% scored less than 50 points.
The pie chart below shows the total percentages of points that patients have scored. It can be seen that most of the patients scored 70 points (33% of all patients) while the smallest number of patients scored 30 points (3.3% of all patients). So far we don’t have any patient who reached maximum points (100 points) or any patient who reached minimum points as 0,10 or 20 points.
| Question: | ‘Options’: “percentage of option from patients” |
|---|---|
| 1. Diabetes is a condition that is a result of | 'Not Enough Insulin': '50.57 %', 'Being Overweight': '19.54 %', 'Eating Too Much Sugar': '16.09 %', 'Too Much Insulin': '6.90 %', 'Eating Processed Food': '6.90 % |
| 2. Diabetes occurs due to problems in which organ? | 'Pancreas': '89.66 %' 'Stomach': '5.75 %', 'Gallbladder': '2.30 %', 'Intestines': '2.30 %' |
| 3. High blood sugar levels can cause: | 'all of the above': '90.80 %', 'increased thirst': '3.45 %', 'frequent urination': '3.45 %', 'blurred vision': '2.30 %' |
| 4. Losing weight may have which benefits for people with diabetes? | 'all of the above': '90.80 %', 'Lower blood sugar': '5.75 %', 'use insulin effectively': '2.30 %', 'lower heart disease risk': '1.15 %' |
| 5. Healthy eating for people with diabetes means: | 'follow a set meal plan': '55.17 %', 'eat moderate amounts of food': '31.03 %', 'eat lean meat and veggies': '13.79 %' 'eat snacks': '0.00 %' |
| 6. What causes hypoglycemia? | 'all of the above': '63.22 %', 'too much insulin': '21.84 %', 'not enough food': '12.64 %', ' too much physical activity': '2.30 %' |
| 7. The nutrient that has the greatest effect on blood sugar levels is: | 'carbohydrates': '47.13 %', 'sugar': '34.48 %', 'protein': '13.79 %', 'salt': '2.30 %', 'fat': '2.30 %' |
| 8. What causes hypoglycemia? | 'True': '64.37 %', 'False': '35.63 %' |
| 9. There are no forbidden foods for a person with diabetes | 'False': '78.16 %', 'True': '21.84 %' |
| 10. Physical activity and exercise | 'all the above': '88.51 %', 'helps lower blood sugar levels': '8.05 %', 'helps with weight loss': '2.30 %', 'improves mood/helps with stress': '1.15 %', 'lowers BP and cholesterol: '0.00 %' |
Most patients received the first test in the first 3 weeks of using Rita. We analysed the time period of 70 patients who submitted the survey once and how much Rita’s tasks affected the survey result.
49 patients took the test in the first 3 weeks of the program. 21 patients took the test between 3 weeks and 2 months. We divided patients according to the ratio between “number of tasks from the start of the program to survey day” and “days from the start of the program to survey day”. 11 patients who completed more than 3 educational tasks per week (ratio 1 : 0.4285) performed better with an average score of 68.18 points (50 points: 2 patients, 60 points: 1 patient, 70 points: 5 patients, 80 points: 3 patients) in comparison with 10 patients who have completed less than 3 tasks per week. These 10 patients resulted in 9.18% fewer points with an average of 59 points in total (50 points: 4 patients, 60 points: 4 patients, 70 points: 1 patient, 80 points: 1 patient).
By analyzing 10 patients who submitted the survey more than once we can see that 5 of them have shown a gain of knowledge about diabetes by an average of 18% (individual knowledge growth for these patients varies from 10% to 30%), 3 of them had lower scores with an average decrease of 23.33% and 2 of them had constant scores. In the table below is shown the score, the progress and time difference between the first and last survey.
Patients who have regularly attended Rita’s program (ratio between number_of_tasks and days_with_Rita is approximately 1 or higher) have shown higher scores than patients who have paused from time to time throughout the program. They showed higher results because the longer they stayed fulfilling Rita’s tasks, the more educational topics were offered to them. This increased the level of knowledge about diabetes and taught patients how to take care of themselves.
Some of the educational topics related to diabetes offered during the program were: ‘Portion Plate Method’, ‘Figuring out When to Eat’, ‘Quit Tobacco’, ‘Food and Eating Out’, ‘Take Care of your Feet’, ‘Diabetes and Illness’, ‘Diabetes and Travel’, ‘Diabetes and Driving’, ‘Intro to Diabetes’, ‘Healthy Eating’.
Patients who did not show satisfactory results were those who stayed in the program for a long time but didn’t complete the tasks daily or patients who completed the tasks but the time between the first and second test was very short. In conclusion, most factors that affect the Diabetes Survey score are:
– The patient’s time in the program
– The number of completed tasks offered by Rita
– The time interval between the first and second test
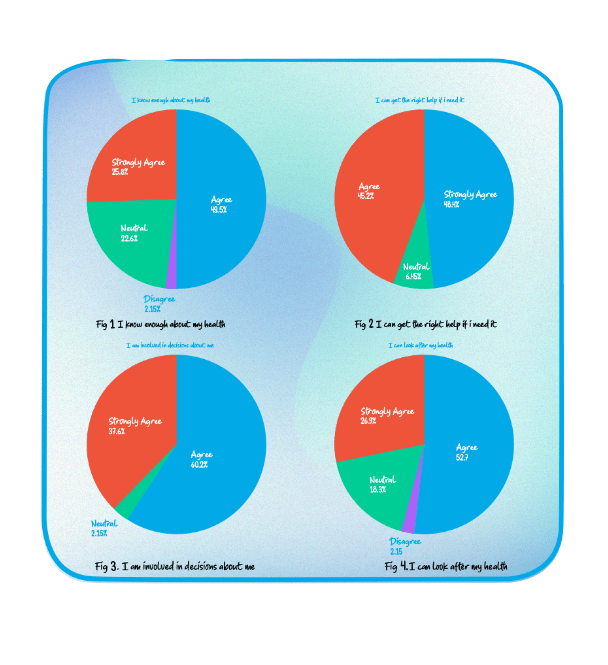
Below are shown visualizations to the answers of each inquiry
78 patients were part of the health confidence survey where 10 of them filled the survey twice.
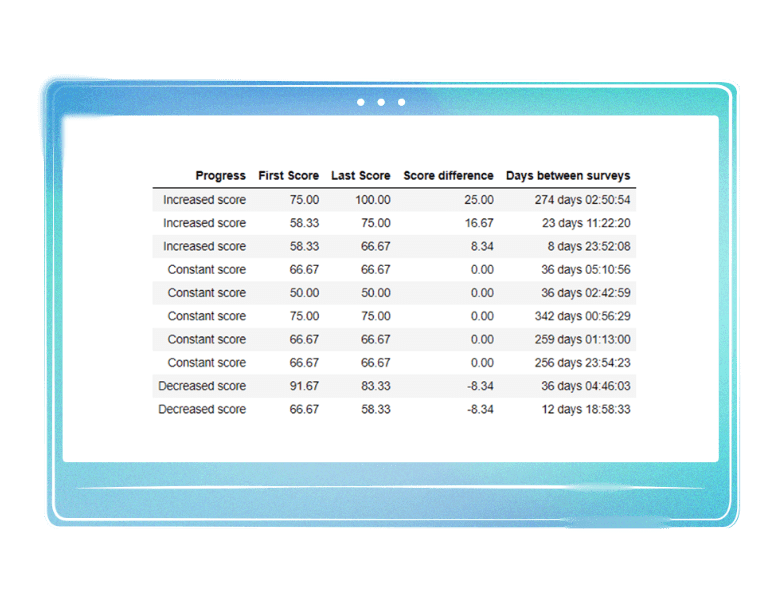
From the table above it is shown that 3 out of 10 patients had an increase in score, 5 of them had constant score and 2 of them had a decrease in score. There would be more accurate results if all patients filled the survey twice, at the beginning and at the end of the program.
There was only one survey taken from 3rd to 8th month.11.28% of surveys were taken in the last two months of the program with an average score of 85%.
68 patients who filled the survey once have scored as follows:
18 of them scored 100%, 7 of them scored 91.67%, 4 of them scored 83.33%, 14 of them scored 75%, 28 of them scored 66.67%, 12 of them scored 58.33%, 5 of them scored 50%. More detailed Health Confidence data for each patient found here.
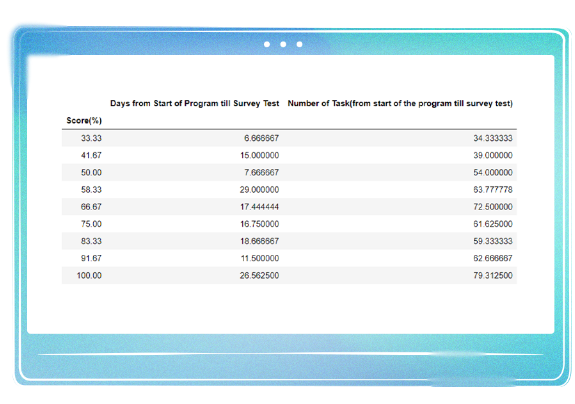
By grouping patients based on survey points and analyzing the average number of tasks from the day of the program to the day of testing we can understand that the higher the number of tasks completed the more confident the patient is in terms of his health. We can verify this with the table below:
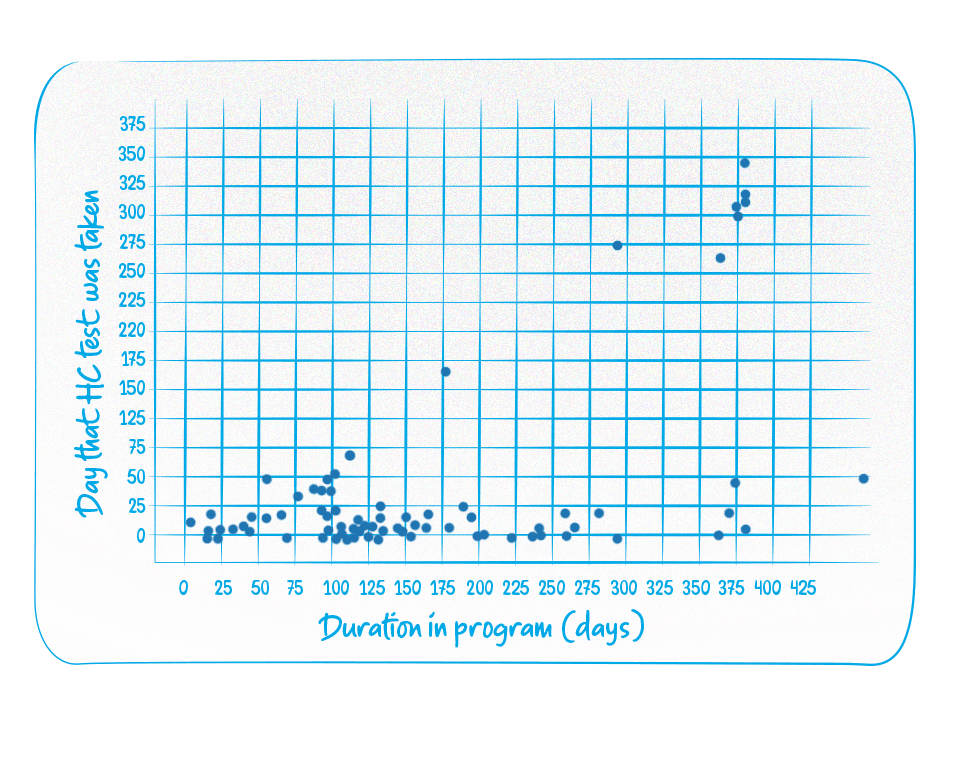
Below is shown Duration in program [days] vs. Day that HC test was taken.
77.41% of health confidence surveys were taken in the 1st month of the program with an average score of 84.25%. 10.75% of surveys were taken in the 2nd month of the program with an average score of 81.25%.
We can say that the number of educational tasks has made the patient gain knowledge about health and started to become careful about their health conditions
The table shows that patients who showed the most confidence have the largest number of tasks completed within 2-3 weeks of their introduction into the program. Patients who did not show much confidence about their health knowledge or how to take care of themselves had the lowest number of tasks completed. This is normal because patients have just started the program and are expected to increase their health confidence score by staying in the program a little bit longer.
Increased nurse-to-patient ratio
With the help of our platform the possibility of one nurse to monitor many patients has increased. In the beginning one nurse could monitor 2 patients, whereas now, with the help of our platform one nurse manages to monitor 6 patients at a time
| Time interval | Number of nurses | Number of patients | Ratio (nurse : patient) |
|---|---|---|---|
| Nov. 2019 - Dec. 2019 | 8 | 17 | 1 : 2.1 |
| Dec. 2019 - Jan. 2020 | 8 | 20 | 1 : 2.5 |
| Jan. 2020 - Feb. 2020 | 14 | 51 | 1 : 3.6 |
| Feb. 2020 - Mar. 2020 | 17 | 106 | 1 : 6.2 |
| Mar. 2020 - Apr. 2020 | 17 | 108 | 1 : 6.3 |
| Apr. 2020 - May. 2020 | 17 | 108 | 1 : 6.4 |
| May. 2020 - Jun. 2020 | 17 | 109 | 1 : 6.3 |
| Jun. 2020 - Jul. 2020 | 17 | 109 | 1 : 6.4 |
| Jul. 2020 - Aug. 2020 | 17 | 109 | 1 : 6.4 |
| Aug. 2020 - Sep. 2020 | 14 | 109 | 1 : 6.4 |
| Sep. 2020 - Oct. 2020 | 17 | 109 | 1 : 6.4 |
| Oct. 2020 - Nov. 2020 | 17 | 109 | 1 : 6.4 |
| Nov. 2020 - Dec. 2020 | 17 | 109 | 1 : 6.4 |
| Dec. 2020 - Jan. 2020 | 17 | 109 | 1 : 6.4 |
Reduced blood sugar
From November 2019 to January 2021, 109 patients from Kaiser Permanente have signed up on the program. 93 of them were registered as diabetic patients where they had regular blood sugar measurements for a period of time longer than 3 months and 16 of them had blood sugar measurements from time to time.
Highest number of patients (over 90) have been on the program during February and March of 2020.
Starting from April until January 2021, the number of patients who were on the program started to decrease gradually. Below is shown numbers of patients who have signed up on the program each month. 21276 blood sugar measurements are finished within 14 months(as shown in the table below).
If we observe the ratio between the number of patients and the number of measurements we can conclude that most of the patients measured their glucose at least once a day.
70.22% of 21276 measurements have data showing if glucose is measured: before meal, with meal or after meal. 56.07% of measurements occurred before meal, 0.97% with meal and 13.18% measurements occurred after meal.
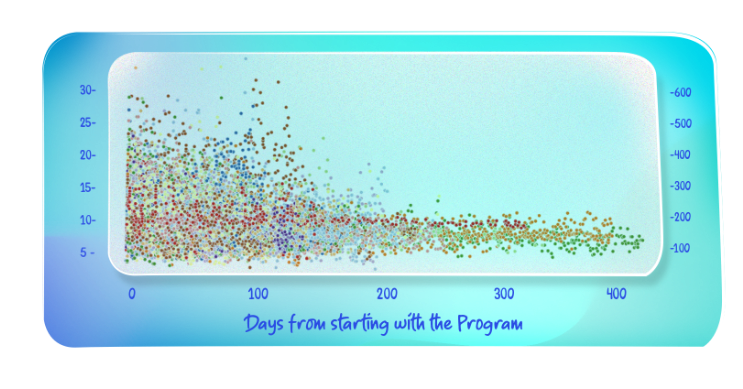
All patients started the program from November 2019 to March 2020. 67.27% of patients started the program in January-February 2020. In terms of patient duration in the program, 33.63% of patients stayed in the program from 1 to 3 months. 47.27% of patients stayed in the program from 4 to 6 months and 19.1% of patients stayed in the program from 7 to 12 months. Below are shown glucose levels for all patients in mg/dL (y axis -right) and mmol/L (y axis -left). Each color represents a patient. All patients are shifted to the left from their first day of starting with the program until the end.
| Time interval | Number of patients | Number of Blood Sugar Measurements |
|---|---|---|
| Nov 2019 | 20 | 309 |
| Dec. 2019 | 33 | 1031 |
| Jan. 2020 | 68 | 2195 |
| Feb. 2020 | 98 | 4041 |
| Mar. 2020 | 94 | 4641 |
| Apr. 2020 | 76 | 3770 |
| May. 2020 | 68 | 2423 |
| Jun. 2020 | 52 | 1326 |
| Jul. 2020 | 26 | 466 |
| Aug. 2020 | 19 | 396 |
| Sep. 2020 | 14 | 198 |
| Oct. 2020 | 10 | 142 |
| Nov. 2020 | 6 | 113 |
| Dec. 2020 | 4 | 127 |
| Jan. 2021 | 4 | 98 |
Emergency visits
According to Kaiser Permanente, with the help of Rita as their virtual assistant, our patients succeeded in monitoring their health condition on a daily basis, this resulted in Reduction in Emergency Visits by 23%
Medication adherence
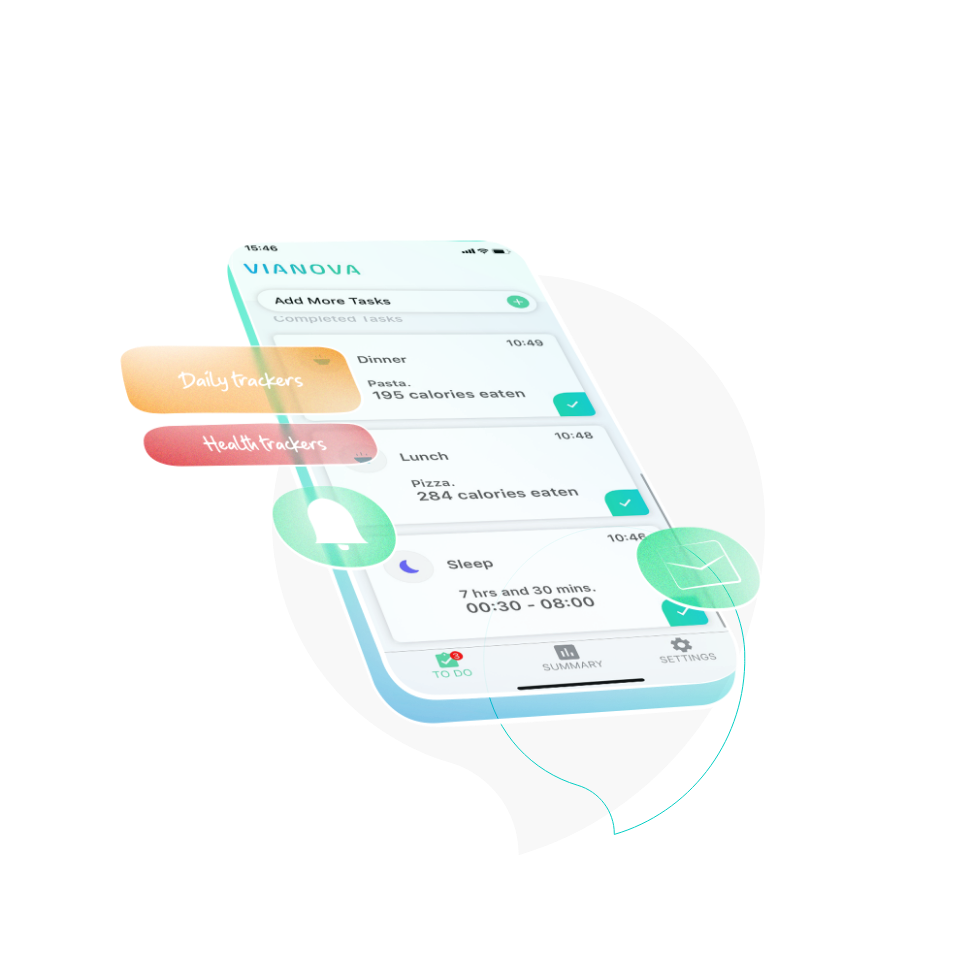
Vianova helps patients and reminds them to take their medications on a daily basis.
72 patients who had to take medications daily from November 2019 to January 2021 were reminded and asked by Rita if they took their medications. 1551 reminders and checkups were sent to those patients during that time interval.
1387 of them were classified as ‘morning medications’ while 164 of them were classified as lIvening medications. When patients ran out of medications they informed Rita about it and a message was sent to their care coordinators instantly. Patients were asked about medications by Rita after some time that the reminder was sent. 88.68% of patients said they took their medications, 9.02% said they will take them now and 2.33% said they didn’t take their medications.
Vianova Remote Patient Monitoring
Sign up for Vianova’s pilot program today!
We believe in our product so much that we think it sells itself. Sign up for our Pilot program and dive into how our Platform really works.
What do you get from the pilot program?
Set up training sessions for your staff to make using our platform a breeze, including training on our Dashboard, App, and RCB, with additional training available throughout your pilot.
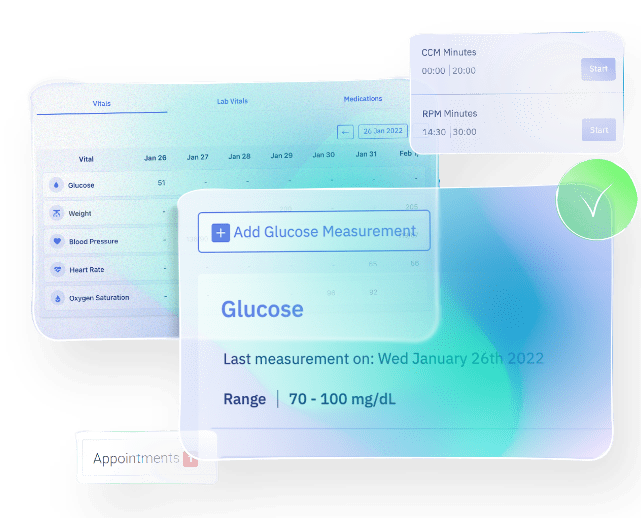
Get a customizable dashboard
Get a customized dashboard, and test on 50 patients using our Vianova App (available on Apple Store and Google Play Store).
Easy access
Assign care plans to your patients and test out our platform’s functionality including video calls, chat function.
Simple management
Make your patient management simple with easy data collection including vitals and medication adherence options.
Staff support
Call center staff is available to assist with patients in both English and Spanish.
Secure data
Data is stored on encrypted, HIPAA compliant servers.
Multilingual translation
Care Plans can be easily translated into any language!
A definitive guide
The Vianova Remote Patient Monitoring Platform PILOT begins with a training session that explains how it works step by step.
Vianova initiates a session with the clinical staff to ensure that they are equipped well enough to pass on th e knowledge as to how the technology is used to the patients.
Therefore, Vianova to doctors/nurses/medical technicians to patients.

Vianova's Partnerships
Please see below a breakdown of steps to the “pilot training session”:
Vianova will be generating the profile for the clients’ organisation on the Vianova Dashboard and software application for access to be given to the users which the client deems. I.e. doctors, nurses, administrators etc.
After the profile for the organization and its users have been generated, Vianova then creates a pool of 50 dummy patient profiles which will be connected to the Vianova application on the clients’ device. I.e. smartphone, tablet.


In relation to the 50 dummy patients’, if required, their profiles can be modified to contain information about thve real-life person. I.e. name, phone number (which is also used to log in to the Vianova app), etc. This is in order to allow the clinicians who will be offering the Vianova solution, to demonstrate a “real” case of how Vianova can be used to interact with on boarded patients and vice versa.
Care plans can also be assigned to the pool of dummy patients to help in the understanding of how the Vianova app and dashboard are used in a healthcare setting.
Once the pool of patients has been onboarded, the communication between the clinicians and the patients can be done via the Vianova app features. I.e. sms, phone (AI), chatbot, other notifications. (communication between patients and clinicians)
Usually, but depending on the clients’ request, Vianova provides 1 training session over the Vianova patient app where the knowledge of using the functionalities and the app features are passed on to its’ users.
In addition to the patients’ app training for the clinicians who will be carrying the training session, an additional 1 or 2 training sessions are provided in relation to the Vianova Dashboard and its features.
Dashboard training 1-2 hours

App training 1-2 hours
RCB training (if needed) 2 hours
Confirming care plans are aligned
Reporting back with the data received by patients.
By this point, the clinicians should be well equipped to understand the platform as a whole. If further assistance is required, Vianova will provide it.
If a client requests that the content (clinical content) be translated in a given language, usually, Vianova sends a draft file containing the app and dashboard content as a reference which is to be considered when translating it. The content includes the words from the application menus.
Once the content is translated, it is uploaded in the technology for the client to use based on their preference. In addition to the dashboard translations, if requested by the client, the care plans are to be translated also to ensure that they include all vital tasks, education tasks, and videos in the required language.


Vianova does not take the responsibility to translate the content.
Vianova support team (call center) is available in the Eastern and Western US time zones in both English and Spanish. However, if the client wishes to set up a call center to support their workload, the clients’ staff members must be trained by the Vianova team so that they are well equipped to use the technology. It is important that the training is carried out in an adequate way in conjunction with the clinicians who will be communicating with the call center team and the patients (Critical and sensitive). All the patient data that will be generated from the pilot will be stored on Vianovas’ server. Vianovas’ data are encrypted and secured using HIPAA-compliant solutions and the communication is handled through SSL (secured layer of network). The data is secured and stored on US servers, but if the client wishes to encrypt and store the given data on their own servers, the infrastructure shall be analyzed to check if that will be possible.
Care plans can also be assigned to the pool of dummy patients to help in the understanding of how the Vianova app and dashboard are used in a healthcare setting.
HEALTHCARE
Clinician developed care plans focused on medication adherence, vital readings collection, and disease based education, along with coaches who work with patients to develop healthy habits.
EDUCATION
Our platform focuses on providing students with engaging, easy to learn content while they develop the habit of learning.
GIVE-TECH
We make it easy for nonprofits to engage their donor base through updates and fundraisers, while smoothing the way to spread the word